Setting resolution and aspect ratios in R
Tips and tricks for saving figures in R.
By Cecina Babich Morrow in R
May 23, 2019
Inspiration for this post
I recently needed to make some figures to present and noticed that the ones I was importing from saved R plots were showing up fuzzy on the presentation. Shortly afterwards, I had interns trying to generate figures with the same aspect ratio from different computers. I did a little digging and found this method for saving figures with specified resolutions and aspect ratios.
Solution
In order to save your figure with a certain size and resolution, you just need to include your code for plotting between the two lines below:
# To save a .png file:
png("your_image.png", units = "in", width = 5, height = 4, res = 300)
# your plotting code here
dev.off()
You can also save .bmp, .jpeg, and .tiff files in the same way with the bmp, jpeg and tiff functions.
Example
To see this in practice, we can plot some data from the iris dataset the “regular” way:
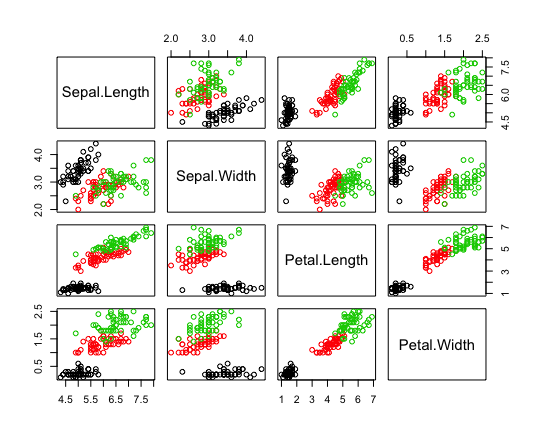
pairs(iris[,1:4], col = iris$Species)
Things look pretty nice in the plotting window, but when you save that figure from RStudio, this is the result:

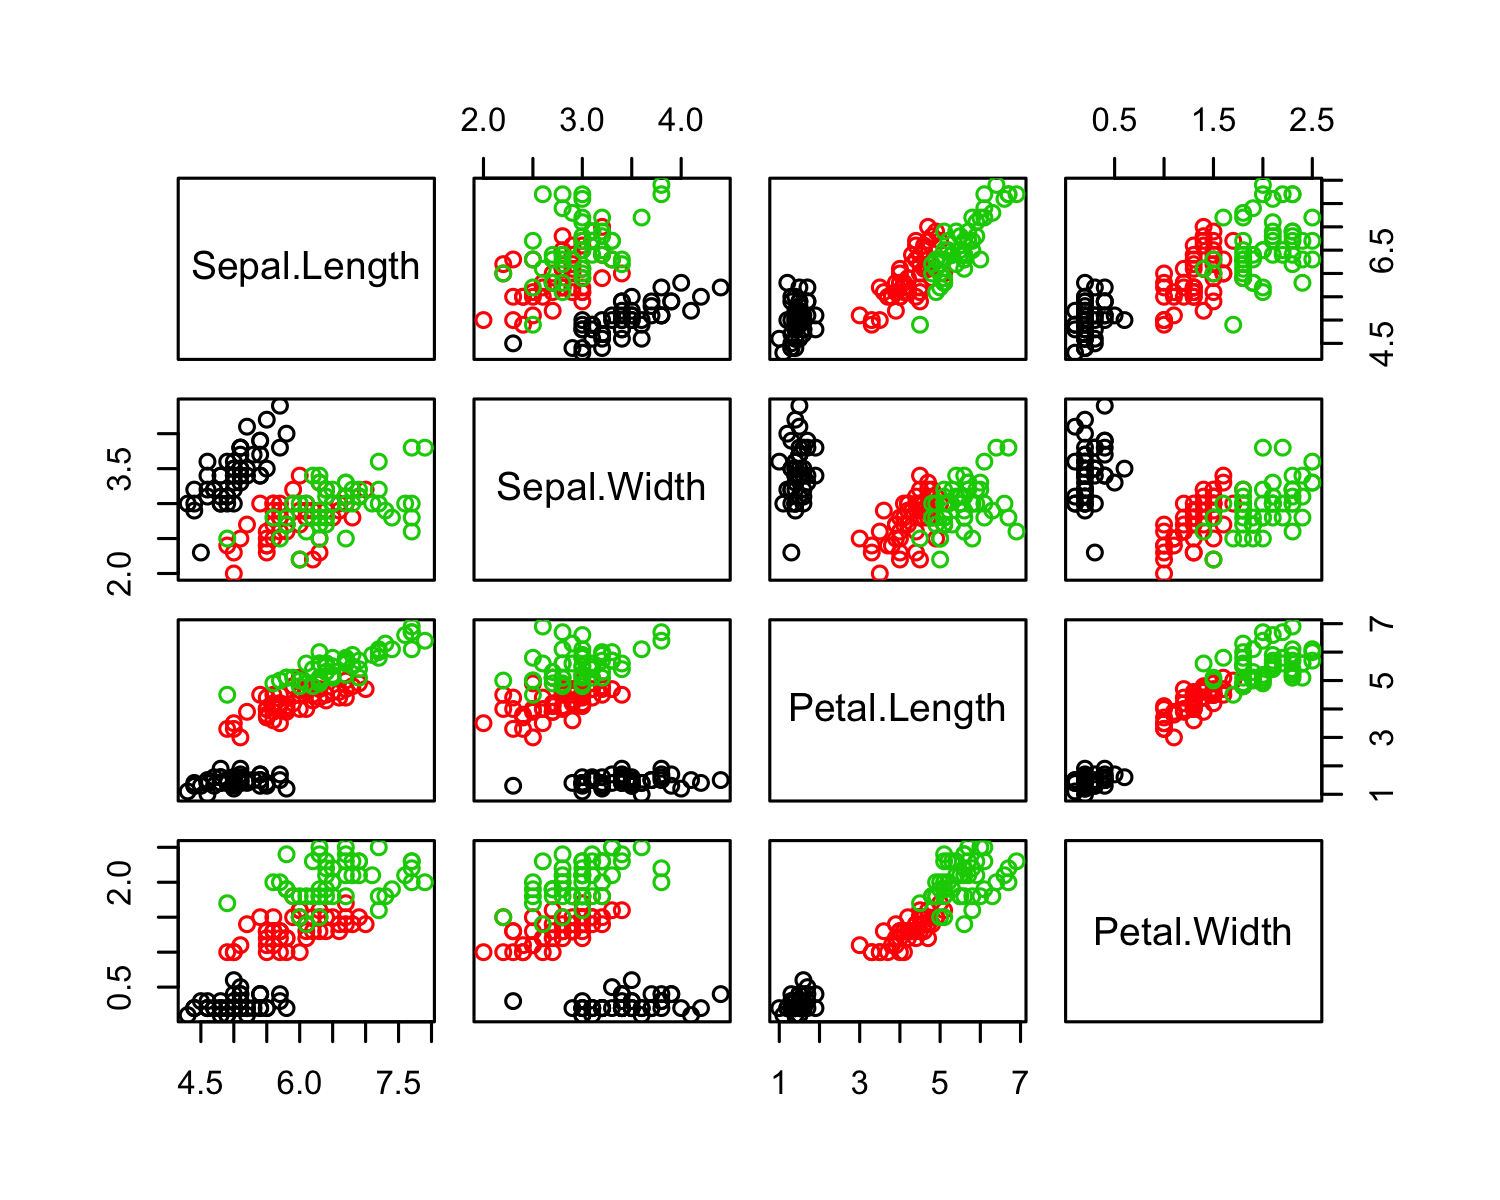
To get rid of that graininess, we can instead save the figure in the following way:
png("highres.png", units = "in", width = 5, height = 4, res = 300)
pairs(iris[,1:4], col = iris$Species)
dev.off()
The resulting figure is much clearer and ready to be inserted in presentations or publications!

You can also change the aspect ratio by modifying the height and width arguments. You can leave the units in inches or set it to pixels ("px"), centimeters ("cm"), or millimeters ("mm").